Key Performance Indicators
Kenmare uses various financial and non-financial performance measures, linked to our strategic objectives, to help evaluate the ongoing performance of the business.
The following measures are considered by management to be some of the most important in evaluating the overall performance of the Group year-on-year.
|
|
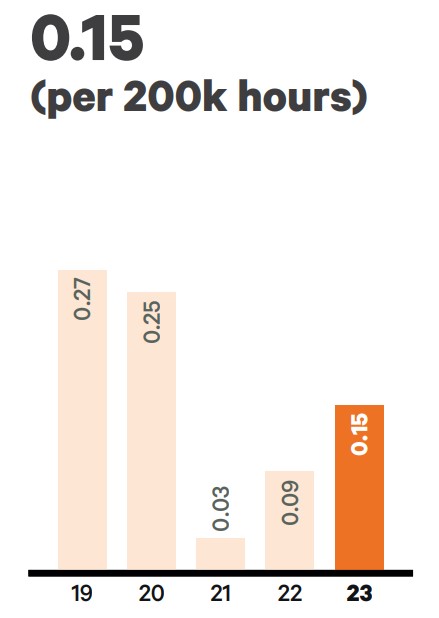
LTIFRDescriptor: Measures the number of injuries per 200,000 hours worked at the Mine, which results in time lost from work Performance: There was a 25% increase in the Lost Time Injury Frequency Rate (LTIFR) in 2023 compared to the three-year rolling average. Action was taken to reverse the trend including delivery of leadership accountability programmes to strengthen the safety culture at Moma; improvements made to the “permit to work” programme, hazard identification and risk assessment protocols; and the introduction of a “Trabalho Seguro” (“Safe Work”) initiative promoting increased safety awareness. This led to zero Lost Time Injuries in Q4 2023 and the milestone of two million hours worked without a Lost Time Injury (LTI) achieved in December 2023. Outlook: Kenmare is committed to continual improvement. In 2024, the Group will reinforce its safety culture through strong safety leadership, as well as continuing to improve its hazard identification and risk assessment practices. In late February 2024, Kenmare was pleased to pass three million hours worked without a LTI.
|
|
|
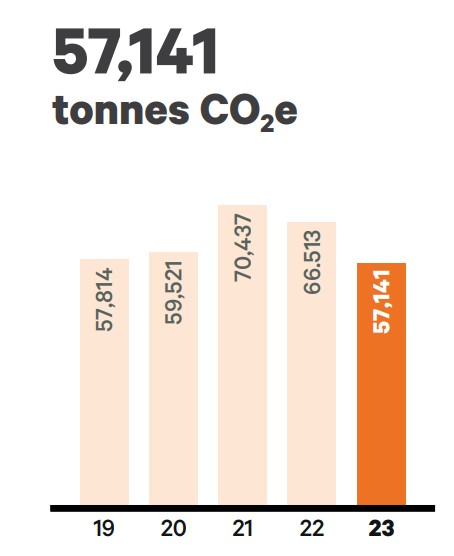
GHG emissionsDescriptor: Measures total Scope 1 and 2 Greenhouse Gas (GHG) emissions. Kenmare acknowledges the human contribution to climate change and aims to reduce emissions from its already low carbon intensity operations. Performance: Kenmare achieved a 14% emissions reduction in Scope 1 GHG emissions in 2023, largely as a result of the Rotary Uninterruptible Power Supply and improved efficiencies in the Mineral Separation Plant (MSP). Kenmare aims to sustain these reductions as much as possible and achieve its 12% reduction target by 2024, relative to the 2021 baseline. Diesel emissions are forecast to increase in 2024, but Kenmare is working to offset these with energy efficiency projects. Outlook: Kenmare has an ambition to achieve Net Zero on its Scope 1 and 2 emissions by 2040, through decarbonisation of its operations. Kenmare has been working on its Climate Transition Plan in 2023 to determine its 2030 target, which will be published in 2024.
|
|
|
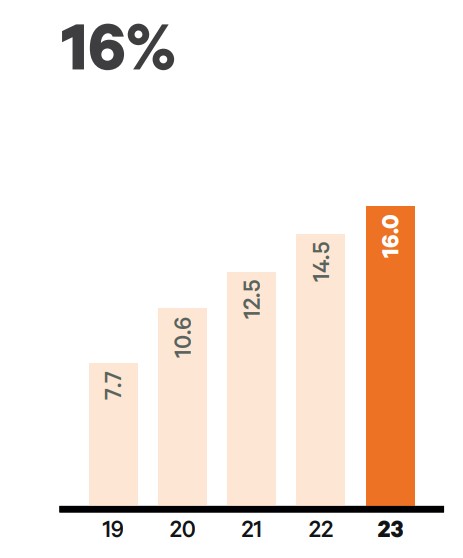
Gender diversityDescriptor: Measures the percentage of female employees at the Moma Mine. Kenmare recognise the benefits to its business of supporting diversity, equity, and inclusion for long-term sustainable success. Performance: Kenmare is working to increase the number of women in its workforce. At year-end, 16% of Mine employees were women, compared with 14.5% in 2022, meeting its stretch gender diversity target for the year. Female representation in Moma Mine senior management reached 40% in 2023, compared to 25% in 2022. Outlook: In 2024 Kenmare aims to increase female representation within its Moma workforce to 17.5%. The Group will progress its structured programme to increase diversity, including initiatives such as its target of 90% of Technical Development Department training candidates to be women. Kenmare is targeting 20% female employees by the end of 2025. |
|
|
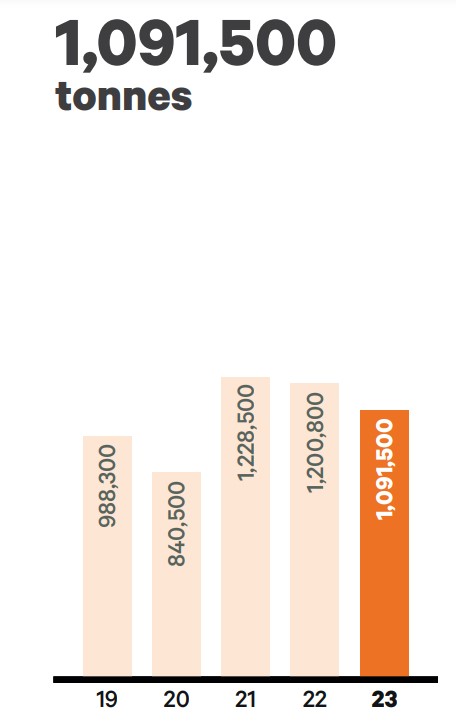
ProductionDescriptor: Provides a measure of production from the Mine and is defined as finished products produced by the mineral separation process (in tonnes). Performance: Finished product production was down 9% in line with lower Heavy Mineral Concentrate (HMC) production in 2023, which was 1,448,300 tonnes, compared to 2022 (1,586,200 tonnes). This 9% annual reduction was a product of a 4% decrease in excavated ore volumes to 38,549,000 tonnes (2022: 40,029,000 tonnes) and a 5% decrease in ore grades to 4.38% (2022: 4.61%). Ore volumes were impacted primarily by the effects of a severe lightning strike in Q1 and power supply interruptions, which affected operations throughout the year. Ore grades were down principally due to Wet Concentrator Plant (WCP) B mining in wetlands, where grades were lower than expected, and WCP A mining lower grade ore as it approaches the end of its mine path in Namalope. Outlook: In 2024 HMC production, and consequently production of finished products, is expected to be in line with 2023. While excavated ore volumes are expected to increase relative to 2023, this will be offset by lower grades as WCP B returns to mine the wetland areas and WCP A continues to approach the end of its mine path in Namalope. |
|
|
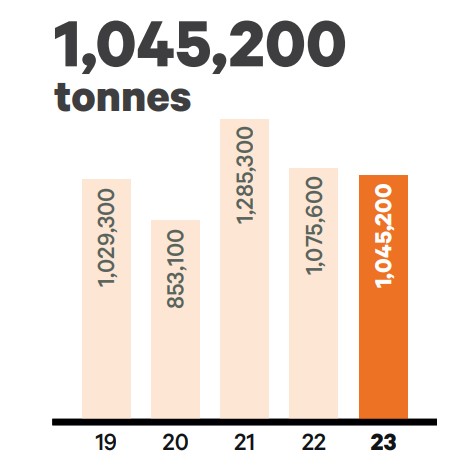
ShipmentsDescriptor: Provides a measure of finished product volumes shipped to customers during the period (in tonnes). Performance: Shipment volumes in 2023 were 1,045,200 tonnes, a 3% decrease compared to 2022, due to more cautious buying from customers during a period of weaker demand, compounded by destocking. Despite poor weather conditions, Q4 was the strongest quarter of the year for shipments, although some shipments were deferred to 2024. Outlook: Shipment volumes are expected to increase in 2024, supported by higher year-end finished product inventories of 259,100 tonnes (2022: 213,500 tonnes). |
|
|
Cash costsDescriptor: Eliminates freights costs and non-cash costs to identify the actual cash outlay for production and, as production levels increase or decrease, highlights operational performance by providing a comparable cash cost per tonne of finished product produced over time. Performance: Total cash operating costs increased by 4% in 2023, compared to 2022. This was as a result of increased operating costs, mainly due to increased heavy mobile equipment rental and higher fuel costs. The per tonne cost increased by 15%, impacted by the 9% reduction in production of finished products. Outlook: Total cash operating costs are anticipated to increase in 2024 due to increased heavy mobile rental requirements and increased power costs driven by increased power usage. Cash operating costs per tonne are expected to increase slightly as production remains in line with 2023. |
|
|
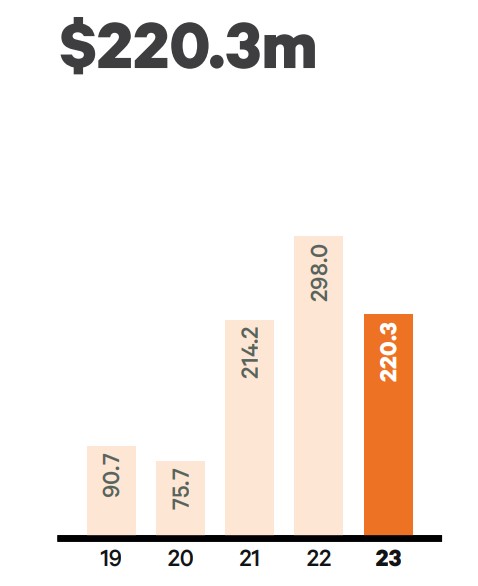
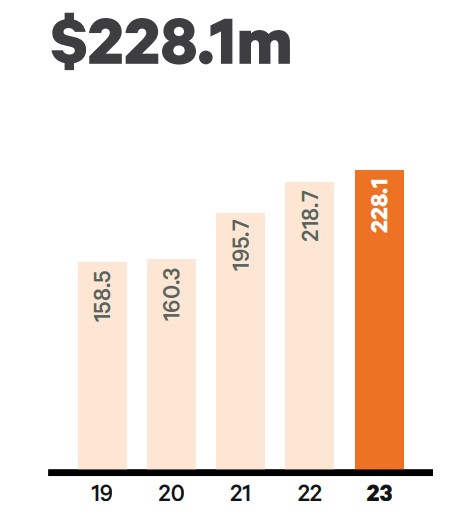
EBITDADescriptor: Eliminates the effects of financing, tax and depreciation to allow assessment of the earnings and performance of the Group. Performance: Kenmare generated the second strongest EBITDA in its history in 2023. However it decreased by 26% compared to 2022, which was a record year. This was driven by mineral product revenue decreasing by 12%, as a result of a 10% decrease in average price received and a 3% decrease in shipment volumes, and total cash operating costs increasing by 4%. Outlook: Kenmare expects to generate robust EBITDA in 2024 based on production guidance and anticipated product pricing. |
|
|
Profit after tax
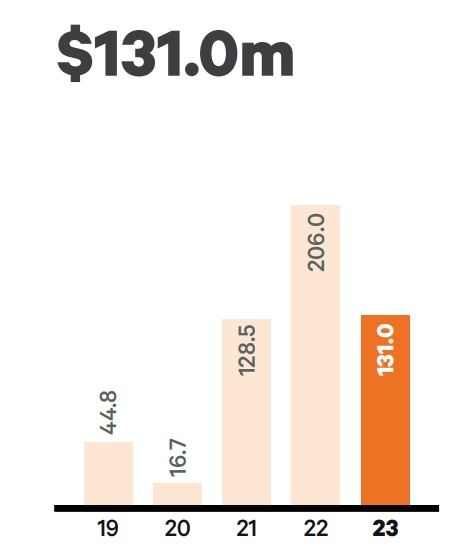
Descriptor: Measures how well Kenmare is managing costs, increasing productivity and generating the most profit from its assets. It is also the basis on which the Group’s dividend payout ratio policy is applied. Performance: Similarly to EBITDA, profit after tax in 2023 was the second strongest in Kenmare’s history at $131.0 million. However it was down 36% on 2022, which was a record year, as a result of lower revenues and slightly higher operating costs in the financial year. Outlook: Kenmare anticipates to generate robust profit after tax in 2024. The Group believes the fundamentals for future earnings remain strong, due primarily to medium- and long-term supply constraints within the titanium feedstocks industry supporting a strong commodity market outlook. |
|
|
Total capital expenditureDescriptor: Provides the amount spent by the Group on additions to property, plant and equipment in the period. Performance: Capital expenditure increased by 16% in the year. $22.8 million related to development capital and $18.2 million related to studies for the transition of WCP A to the Nataka ore zone in 2025. $28.7 million related to sustaining capital on operations. Outlook: Expenditure on development projects and studies is expected to be approximately $189 million in 2024. These costs primarily relate to the transition of WCP A to Nataka and Feasibility Studies for the upgrade works to WCP B. Improvement projects are expected to cost $6 million in 2024 and relate primarily to upgrades to the MSP. Sustaining capital costs in 2024 are expected to be approximately $29 million. |
|
|
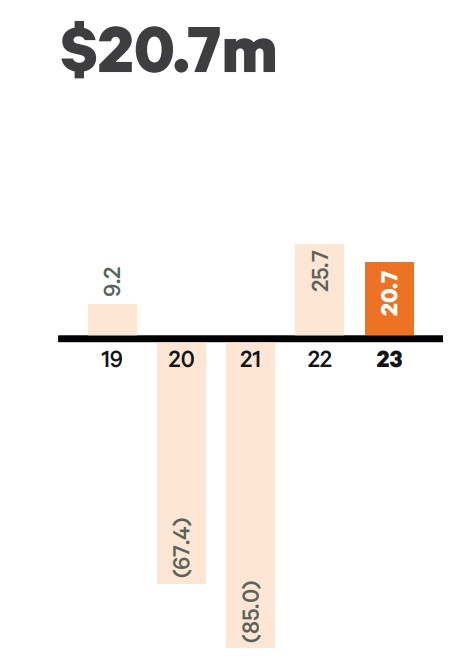
Net cash/(debt)Descriptor: Total cash and cash equivalents less bank loans and lease liabilities: a measure of the Group’s financial leverage and an indication of how Kenmare is managing its balance sheet and capital structure. Performance: Kenmare finished the year with net cash of $20.7 million (2022: $25.7 million). This comprised $71.0 million (2022: $108.3 million) of cash and cash equivalents and gross debt of $48.8 million (2022: $80.8 million), which consists of debt outstanding of $47.1 million and loan interest of $1.7 million. Lease liabilities amounted to $1.5 million (2022: $1.8 million). Outlook: On 4 March 2024, the Group entered into a $200 million Revolving Credit Facility (RCF) with its existing lender group. The interest rate is 4.85% plus SOFR with a term of five years. The RCF replaces the existing corporate debt facilities and will be used to fund the Group’s capital requirements over the next few years, in particular the transition of WCP A to Nataka. |
|
|
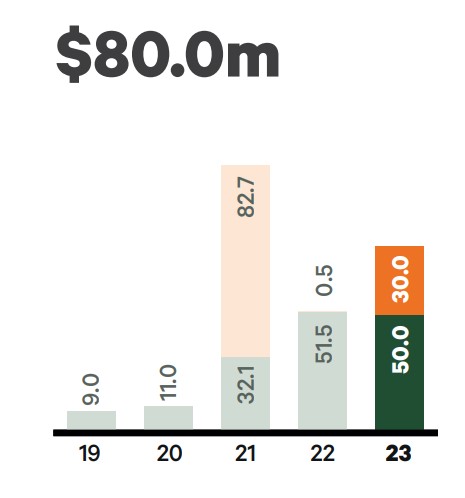
Shareholder returnsDescriptor: Shareholder returns comprise dividends and share buy-backs. Performance: Shareholder returns in respect of 2023 were $80.0 million. This comprised an interim dividend of $15.6 million and a final dividend of $34.4 million, totalling $50.0 million, and a share buy-back of $30.0 million. The 2023 final dividend is to be approved by shareholders at the AGM. Outlook: Kenmare will maintain a target dividend payout ratio of 20%-40% of underlying profit after tax, as part of its strategic priority to allocate capital efficiently. Additional capital returns will be considered against upcoming capital requirements (particularly the transition of WCP A to Nataka), maintaining a strong balance sheet, and market conditions. |
|
|
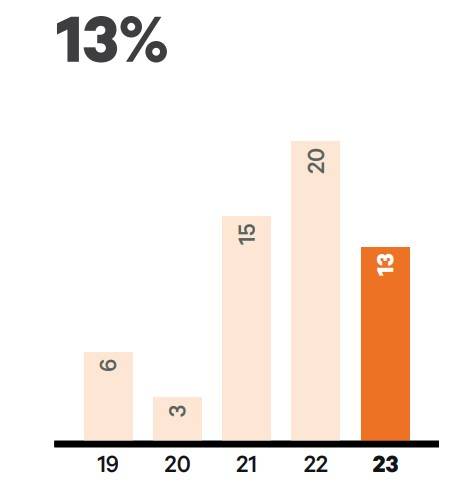
Return On Capital EmployedDescriptor: Return on Capital Employed (ROCE) is defined as operating profit expressed as a percentage of the average capital employed. ROCE is a measure of the profits generated in the year in comparison to the capital investment that has been made in the Company. Performance: The Group continued to generate very strong returns on capital employed. However ROCE decreased by 35% in 2023 driven by lower earnings in the year. Outlook: Kenmare will continue to focus on maximising returns from the Moma Mine over the short, medium and long-term. The Group will also maintain its disciplined and rigorous approach and invest capital only in projects that Kenmare believes will deliver returns that are well above its cost of capital. |